The HSpectralyzer has been developed to analyze star spectra acquired by spectrographs using transmission or reflective gratings.
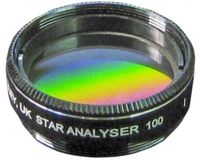
A good example for an affordable transmission grating is the Paton Hawksley Star Analyzer that can be used in the filter wheel of a telescope and even in front of a normal camera lense.
Although there are great software solutions like VSpec, RSpec or ISIS available, the idea of HSpectralyzer is to offer an easy but flexible process to achieve precise and reliable measurements fast.
HSpectralyzer is a free software to make the fascinating hobby of astronomy and its application in citizen science more accessible.
Features:
- Support of Color Filter Array (CFA) as well as mono camera images of the formats FITS, TIF, PNG and JPG
- Live function to monitor a folder and automatically analyze new images to support for example the focusing process
- Save the calibrated spectra as CSV as well as spectral plot images
- Fast calibration on the H-Beta absorption line (RIGHT double mouse click)
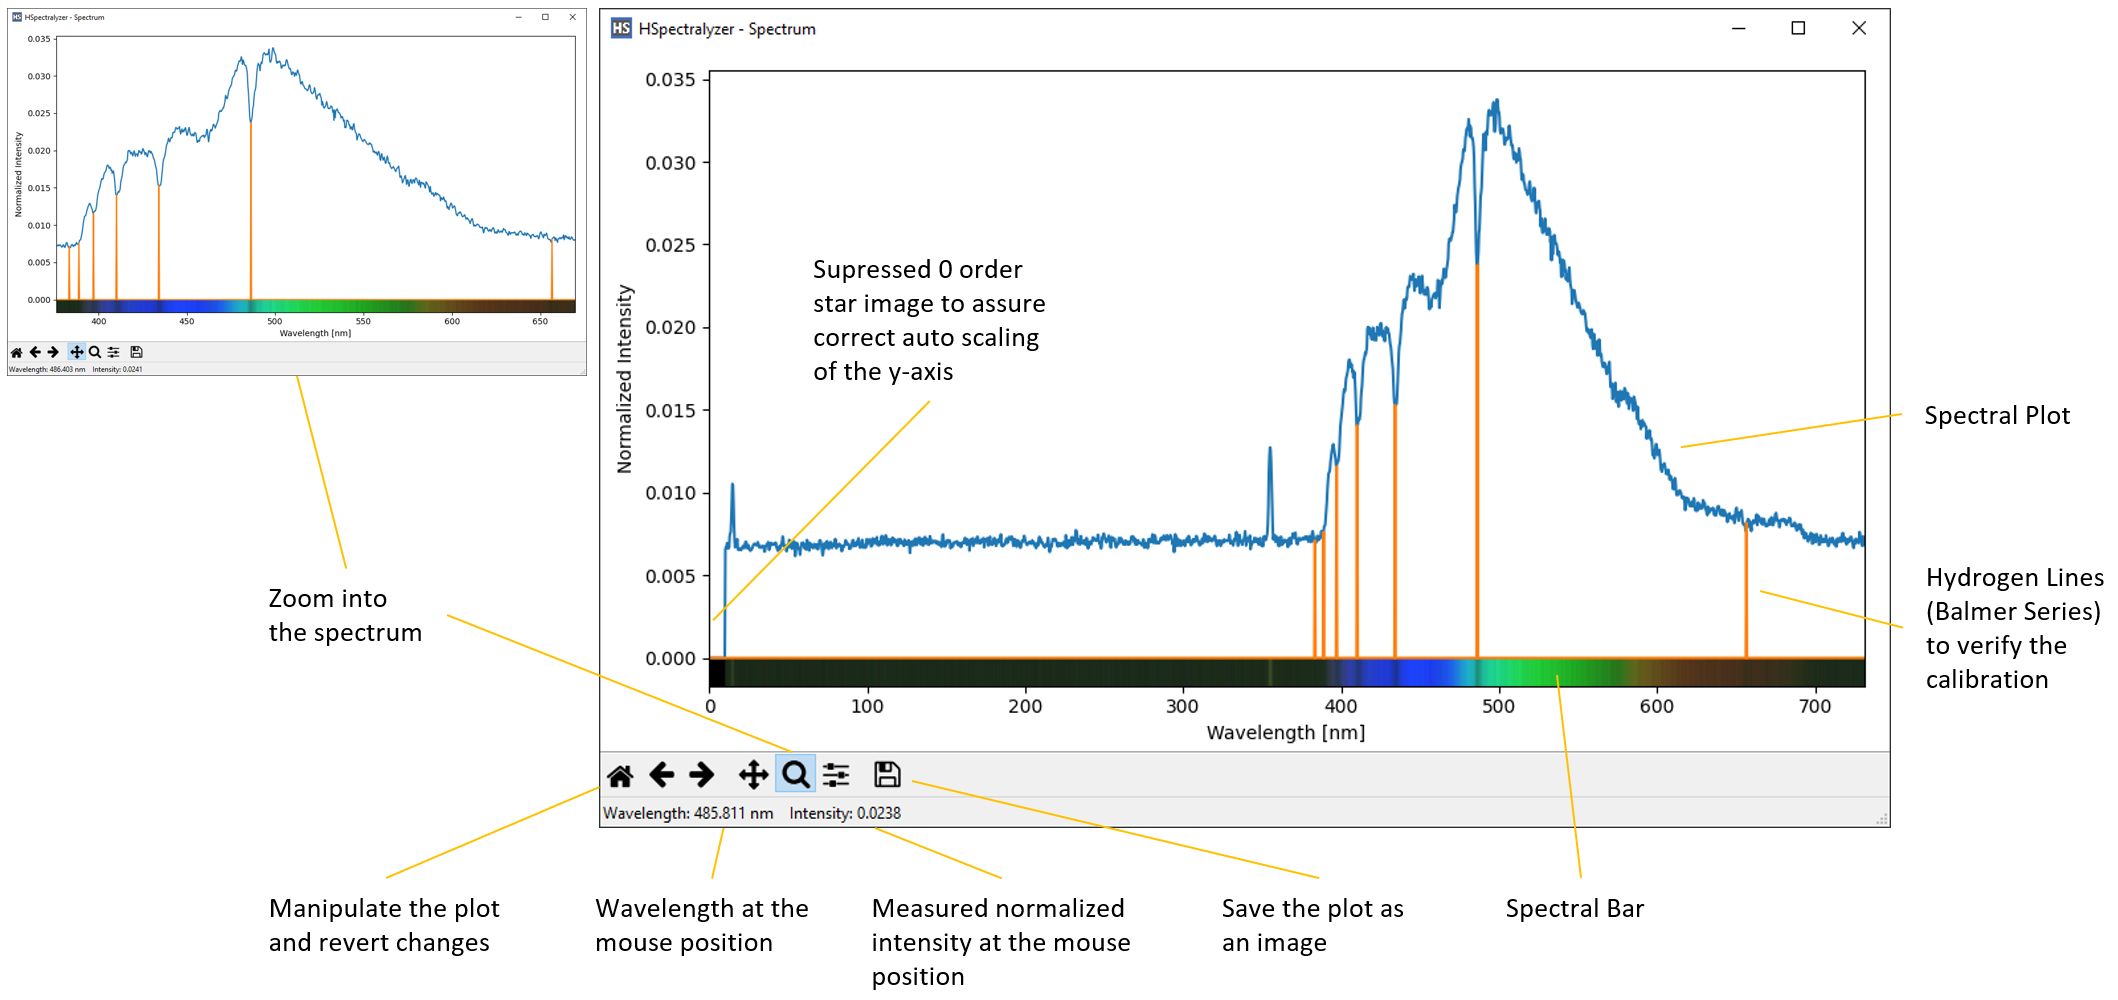
- Balmer Series Hydrogen reference lines to verify the calibration
- Display gain and resizing to allow the precise selection of the star and spectrum
- Various functions to zoom, move and save the spectral plots and to measure the wavelength of spectral features

Examples of what can be measured and analyzed
- Identify different star types (e.g. Wolf-Rayet stars or even our own sun)
- Supernova and Nova spectra
- Observe the variations in star spectra to provide data to the science community (citizen science)
- Detect the emission lines of nebula
- Analyze the atmosphere of the gas giants like Uranus and Neptune
- Detect the red shift of distant objects like Quasars
- and a lot more
Get your 1st spectrum analyzed in less than 60 seconds:
- Open the image (FITS, TIF, PNG or JPG). It is recommended to use FITS or TIF to get 16Bit results.
- Set the image type (Color Filter Array toggle button) when loading FITS or TIF to make sure that in case of a One Shot Color Camera the de-bayering is applied
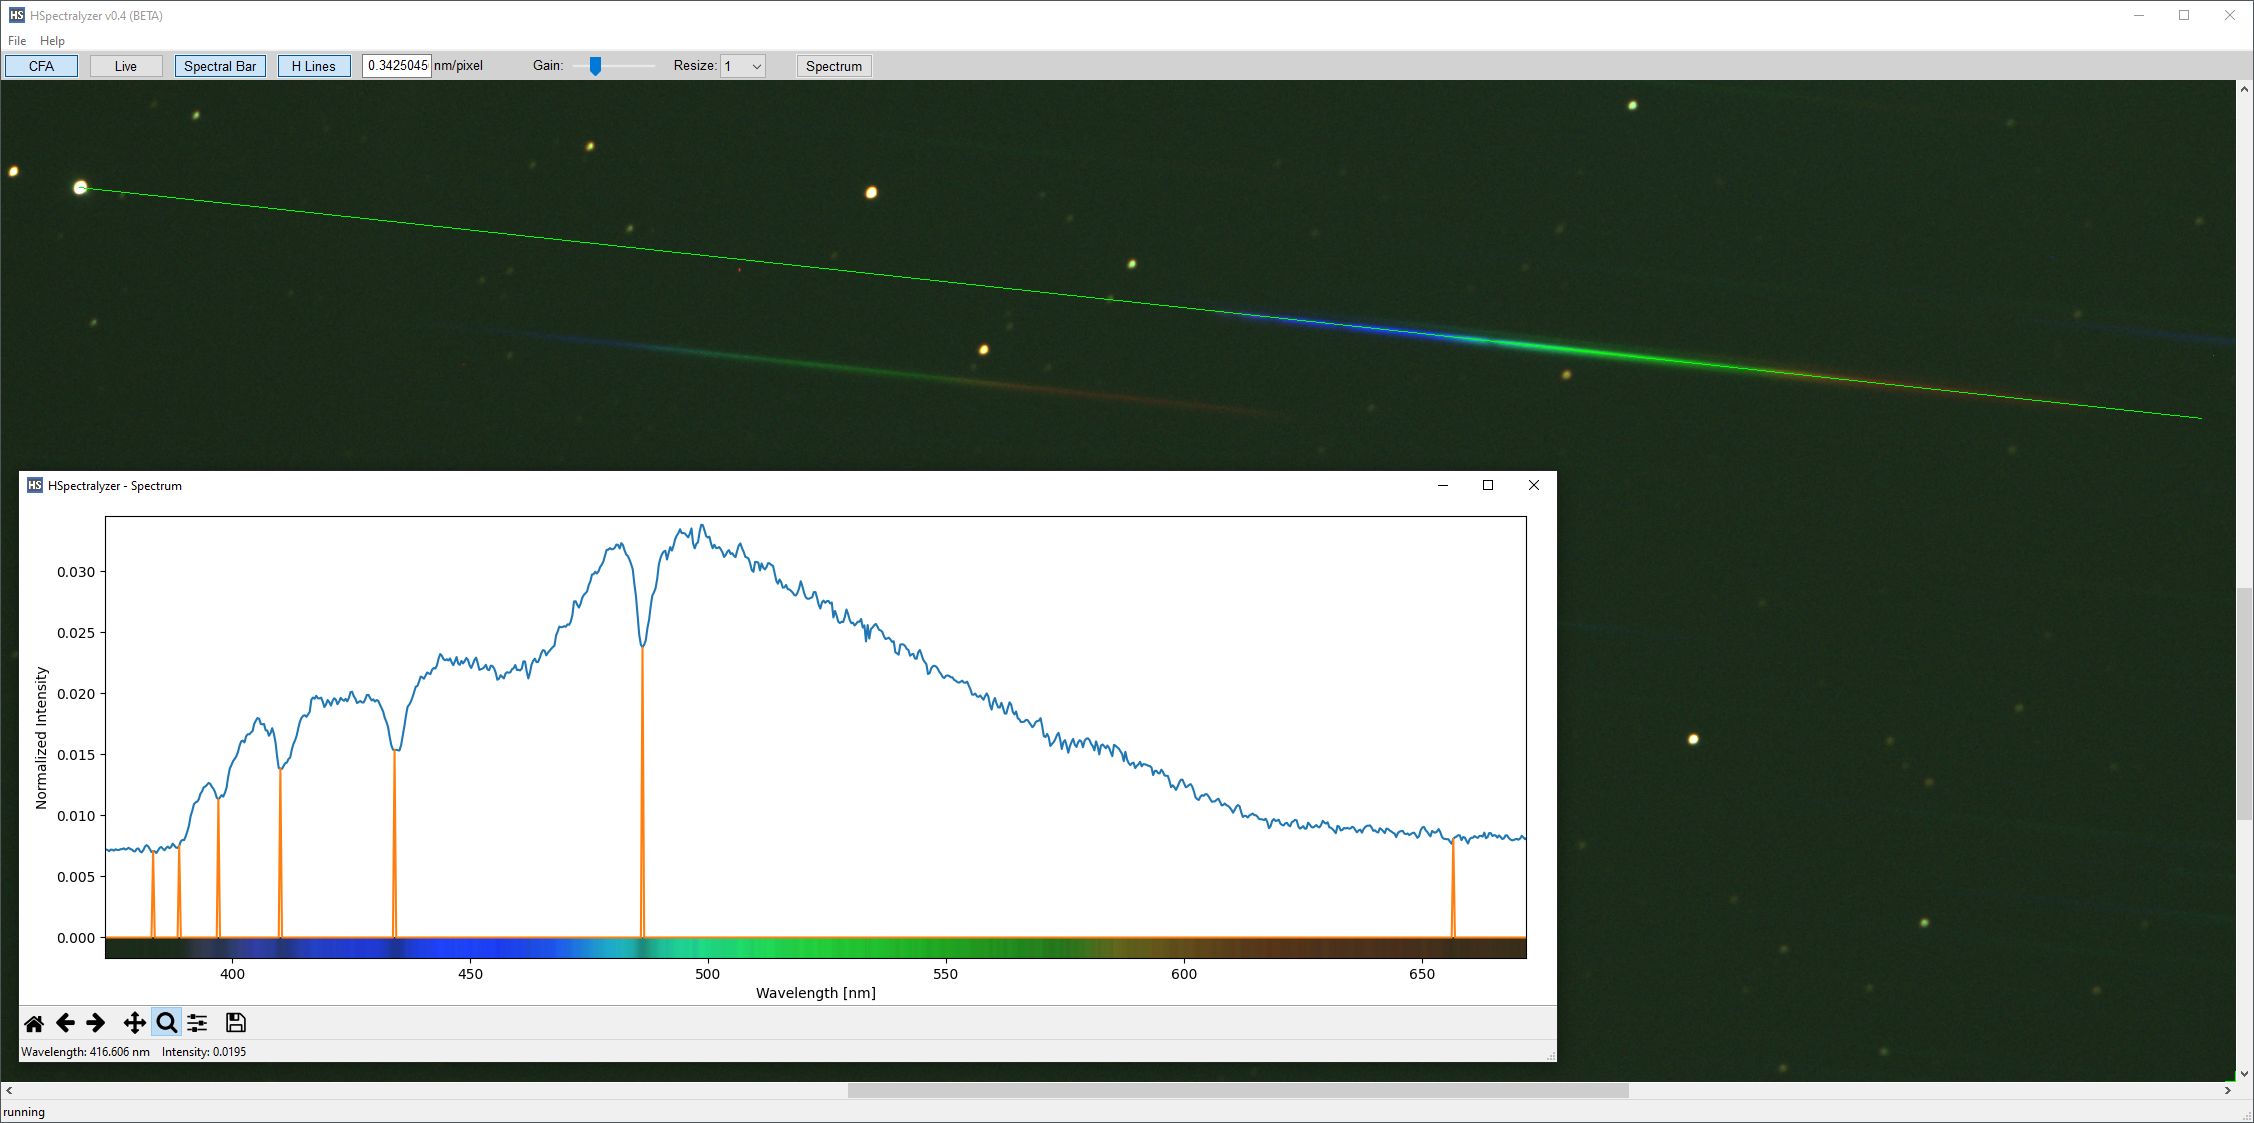
- Scroll the image to see the star (zero order) and the 1st order spectrum
- 1st left mouse click on the center of the star to set the beginning of the measurement line
- 2nd left mouse click behind the end of the spectrum, making sure that the red measurement line covers the spectrum.
The measurement line changes to green as soon as the 2nd mouse click has been committed. - Click on „Spectrum“ to reveal the spectral plot
If there is a need to reset a measurement point then just use a single click of the right mouse button.
It is also possible to set the 1st measurement point on the star and then scroll the image until the end of the spectrum is visible to set the 2nd measurement point. This assures that always a resize factor of 1 can be used to achieve the highest measurement point setting precision.
Nevertheless, the resizing of the displayed image has no impact on the image data used for the spectral measurement. So, for a quick measurement in large images a resizing factor of 1/4 can be easily used.
The recorded 1st order spectrum must be on the right side of the zero order star image. The angle of the spectrum is not that critical but the measurement gets more precise with lower angles.
SAO 209 (Mag 6.5, Spectral Type: A3V) taken with a 60mm refractor.
Live Mode
The live operation can be used to monitor the recording of spectral images and to assist in finding the right focus for the 1st order spectrum.
HSpectralizer loads any new image file appearing in the monitored folder and applies the spectral measurement to it.
Setup:
- Load an image from the folder to be monitored
- Do the spectral measurement for the object under observation
- Start the live mode by clicking the Live toggle button
Calibration
HSpectralizer needs to know which camera pixel represents which wavelength to make sure that the displayed wavelength matches the features (e.g. absorption lines) of the recorded spectrum.
A transmission grating is creating a linear spectrum where the zero order star image represents a 0 nm wavelength. Therefore, it is only necessary to calibrate on a single known spectral line (e.g. H-Beta at 486.135nm).
That calibration process results in a scaling factor of nm/pixel.
The calibration only needs to be done once under the pre-condition that the spectrograph setup does not change.
Two simple calibration processes are available:
1.) Fast Calibration
- Double RIGHT Mouse Click on the H-Beta (486.135nm) absorption line to be first identified in the recorded spectrum
- To verify the calibration activate the H-Lines (Hydrogen Balmer Series) to check whether they match the absorption lines of the spectrum (e.g. Type-A Star for calibration)
2.) Manual Calibration on any known absorption line
- Set nm/pixel to 1.0
- Move the mouse pointer over the known absorption line and get the displayed wavelength which is in fact then the pixel number
- Calculate the calibration factor = known wavelength / displayed wavelength
- Insert the calibration factor to get the correct displayed wavelength
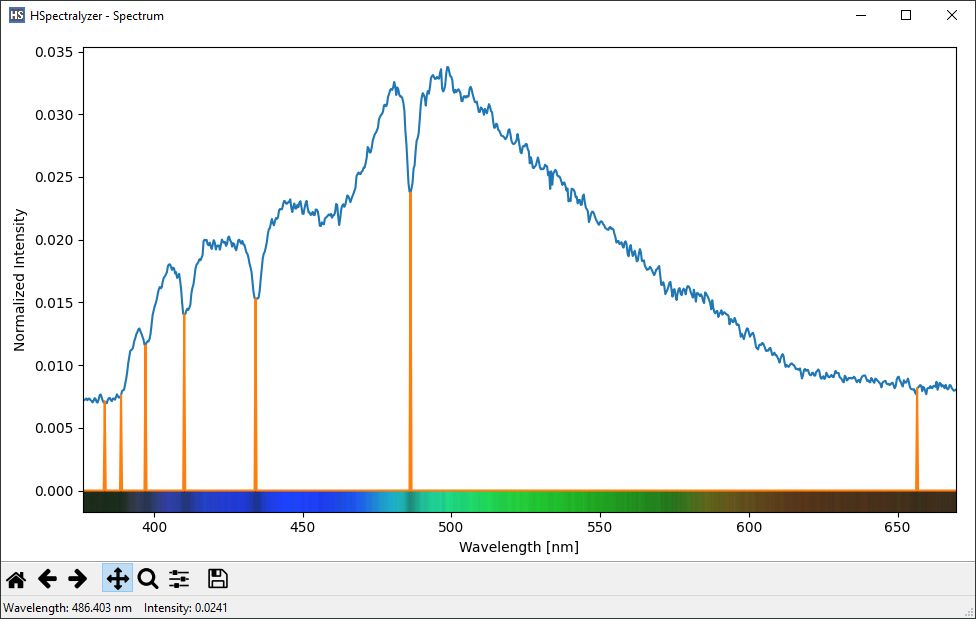
SAO 209 (Mag 6.5, Spectral Type: A3V) taken with a 60mm refractor.
Download v0.5 (BETA)
HSpectralyzer is a free software but not yet open sourced.
Currently only Windows is supported but that may change in the future.
Installation
Just uncompress the ZIP file in a folder and launch the application.
There is no need to install anything.
Known issues
In seldom cases it can happen that the displayed image gets scrambled.
As a workaround just resize the application window or scroll the image.
Possible features for future releases
- Calibration of the instrument response
- Nonlinear calibration to support prism and grism based spectrographs
Disclaimer
THE SOFTWARE IS PROVIDED „AS IS“, WITHOUT WARRANTY OF ANY KIND, EXPRESS OR IMPLIED, INCLUDING BUT NOT LIMITED TO THE WARRANTIES OF MERCHANTABILITY, FITNESS FOR A PARTICULAR PURPOSE AND NONINFRINGEMENT. IN NO EVENT SHALL THE AUTHORS OR COPYRIGHT HOLDERS BE LIABLE FOR ANY CLAIM, DAMAGES OR OTHER LIABILITY, WHETHER IN AN ACTION OF CONTRACT, TORT OR OTHERWISE, ARISING FROM, OUT OF OR IN CONNECTION WITH THE SOFTWARE OR THE USE OR OTHER DEALINGS IN THE SOFTWARE.
Licenses used to develop the solution
MIT, BSD, Apache